
BMI Weight Chart for Seniors Female/Elderly Women
In a time when people have become more concerned with diet and exercise, an increase in the population with obesity and extremely higher body weight has also been noticed. The rise in obesity has highlighted the need for reliable body fat measurement tools. Among these, the BMI weight chart stands out for its simplicity and effectiveness.
One of these methods is the use of BMI, or Body Mass Index, serves as a simple method to estimate body fat based on height and weight, indicating if an individual is underweight, normal, overweight, or obese. It’s especially useful for assessing the health and ideal weight of senior women, focusing on the unique considerations for this age group.
For a detailed BMI weight chart, let us take a detailed look at BMI and its calculation with a particular focus on its applications in the estimation of the ideal weight of 60-year-old women i.e. elderly female age group.
What is BMI?
BMI or body mass index is the parameter employed to make an estimation of body fat by taking into account the body weight and height of an individual. Body Mass Index is a well-established numerical system that gives a reliable insight into body weight and the subsequent weight adjustments needed to achieve what is called the ideal body weight.
How to calculate BMI?
A person’s Body Mass Index can be calculated by putting the values of weight and height in the units of pounds (lb) and inches (in) respectively in the given formula:
BMI = Weight (lb) / [Height (in)]2 x 703
The weight can also be taken in kilograms (kgs) but for that, the height value must also be changed into the unit of meter square (m2).
Interpretation of the BMI results
Once you get the BMI score of your patient calculated by the BMI calculator for seniors, the next step is to check your weight status by using the following data:
| The value obtained from the BMI calculator | Weight status |
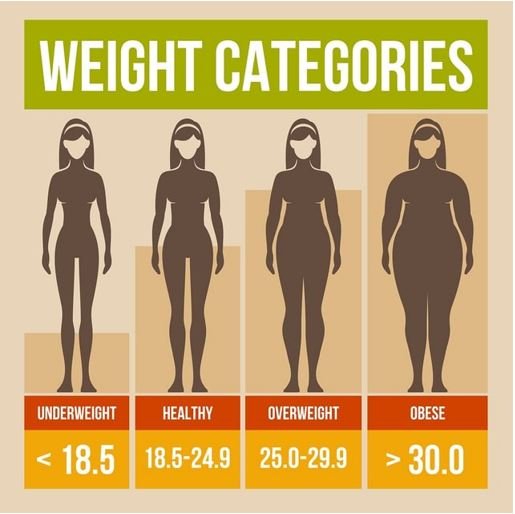
| Less than 18.5 | Underweight |
| Between 18.5 to 24.9 | Healthy weight |
| Between 25.0 to 29.9 | Overweight |
| 30.0 and above | Obesity |

BMI calculator for seniors
The BMI can be calculated by employing the following table in which weight is placed on the x-axis in both kilograms (kgs) and pounds (lbs) while the y-axis contains height in both inches (in) and centimeters (cm). The senior women’s weight chart value is matched with the height value to obtain the BMI which is then estimated based on the color codes given in the chart.

Height and BMI weight chart for women over 60 used for the calculation of BMI
BMI for elderly women or female senior citizens
For women older than 60 years of age, the ideal weight to achieve the normal BMI often reaches 145 pounds. Although, this value varies depending upon a person’s other health parameters as the presence of any kind of ailment often restricts the weight loss efforts or, in other words, makes the obesity static. Here is the weight chart for senior females expressing their weight variations.
Weight chart for senior women
| Height (feet and inches) | Weight (lbs) | Height (cm) | ||
| Small frame | Medium frame | Large frame | ||
| 4’ 10” | 102-111 | 109-121 | 118-131 | 147 |
| 4’ 11” | 103-113 | 111-123 | 120-134 | 150 |
| 5’ | 104-115 | 113-126 | 122-137 | 152 |
| 5’ 1” | 106-118 | 115-129 | 125-140 | 155 |
| 5’ 2” | 108-121 | 118-132 | 128-143 | 157 |
| 5’ 3” | 111-124 | 121-135 | 131-147 | 160 |
| 5’ 4” | 114-127 | 124-138 | 134-151 | 162 |
| 5’ 5” | 117-130 | 127-141 | 137-155 | 165 |
| 5’ 6” | 120-133 | 130-144 | 140-159 | 167 |
| 5’ 7” | 123-136 | 133-147 | 143-163 | 170 |
| 5’ 8” | 126-139 | 136-150 | 146-167 | 172 |
| 5’ 9” | 129-142 | 139-153 | 149-170 | 175 |
| 5’ 10” | 132-145 | 142-156 | 152-173 | 178 |
| 5’ 11” | 135-148 | 145-159 | 155-176 | 180 |
| 6’ | 138-151 | 148-162 | 158-179 | 183 |
Calculate Your Body Mass Index
(BMI)
Weight ranges in elderly women
It can be summarized as the normal weight range for elderly women is from 110 to 170 pounds. In case the women become overweight, this value exceeds 143 pounds. In most cases, this elevated weight is an indication of the presence of a disease state. However, old age itself has its effects on human weight as the fat content of the body increases.
Prevalence of obesity in elderly women
Furthermore, when it comes to obesity, the statistics have manifested that elderly females are more likely to be obese as compared to men of the same age group.
National Health Institute (NIH) has issued numerical data, based on the findings of National Health and Nutrition Surveys, indicating that the prevalence rate of obesity in elderly women i.e. women over 60 years of age is 39.4% while in elderly males, it is nearing 37.5%. This obesity further increases the chances of the development of multiple diseases.

Statistics related to the prevalence of obesity
How to maintain a healthy BMI?
Maintaining a BMI within the normal range helps in ensuring the health status to some extent. However, active steps are to be taken in order to hinder this Body Mass Index from shifting. Here are some of the things which can be done for the maintenance of a normal BMI:
- By eating a balanced meal that includes protein, carbohydrates, good fats, and fiber.
- By the addition of vegetables and fruits to the daily diet.
- By maintaining a routine of exercise.
- By avoiding processed food.
What are the Limitations of BMI in Senior Women
While Body Mass Index (BMI) is a widely used tool for assessing weight relative to height, it has notable limitations when applied to older adults (especially senior women). As we age, our bodies undergo significant changes that can make BMI a less reliable indicator of overall health.
Why BMI May Mislead in Seniors
- Muscle Loss (Sarcopenia): Aging often leads to a natural decline in muscle mass. A senior woman may have a “normal” BMI but still suffer from low muscle strength and mobility.
- Fat Redistribution: Older adults tend to accumulate more fat around the abdomen, even if their overall weight remains stable. BMI doesn’t account for where fat is stored, which is crucial for assessing health risks.
- Bone Density Changes: Osteoporosis and reduced bone mass can lower body weight, potentially skewing BMI results downward without reflecting true health status.
Complementary Tools for a Fuller Picture
To better understand body composition and health risks in elderly women, consider using these additional metrics:
- Waist Circumference: A waist measurement over 35 inches (88 cm) in women is associated with increased risk of heart disease and type 2 diabetes.
- Body Composition Analysis: Tools like bioelectrical impedance or DEXA scans can differentiate between fat, muscle, and bone mass.
- Functional Assessments: Grip strength, walking speed, and balance tests can offer insight into physical health beyond weight.
Alternative Metrics That Matter More than BMI
Instead of relying solely on BMI, these metrics provide a more nuanced view of health in senior women:
1. Waist-to-Height Ratio (WtHR)
- Formula: Waist circumference ÷ height
- Ideal Range: Less than 0.5
- This ratio is a strong predictor of cardiovascular risk and is especially useful for older adults with central obesity.
2. Body Fat Percentage
- Healthy Range for Senior Women: Typically between 25% and 35%
- Unlike BMI, this metric reflects actual fat content and can be measured using skinfold calipers, smart scales, or clinical scans.
3. Waist-to-Hip Ratio (WHR)
- Formula: Waist circumference ÷ hip circumference
- Risk Thresholds:
- Low risk: < 0.80
- Moderate risk: 0.80–0.85
- High risk: > 0.85
- WHR is particularly useful for identifying abdominal obesity, which is linked to metabolic syndrome and cardiovascular disease.
Age-Specific Health Implications of BMI in Elderly Women
As women age, the relationship between BMI and health outcomes becomes more nuanced. While BMI remains a useful screening tool, it must be interpreted in the context of age-related physiological changes.
Health Risks Associated with High or Low BMI
According to the CDC and WHO, both elevated and reduced BMI levels in older adults are linked to serious health conditions2:
- Osteoporosis: Low BMI is associated with reduced bone density, increasing the risk of fractures and falls.
- Frailty Syndrome: Underweight seniors may experience muscle wasting, fatigue, and decreased mobility.
- Type 2 Diabetes: Higher BMI correlates with insulin resistance and increased risk of diabetes.
- Cardiovascular Disease: Excess abdominal fat (often missed by BMI alone) raises the risk of hypertension, stroke, and heart disease.
- Cognitive Decline: Obesity in older adults has been linked to increased risk of dementia and reduced brain volume.
Geriatric Guidelines Emphasize Context
- The CDC notes that BMI should be used alongside other indicators like waist circumference, physical function, and comorbidities.
- WHO recommends age-adjusted interpretations of BMI and encourages the use of body composition metrics for older populations.
Nutrition & Lifestyle Guidance for Senior Women
Maintaining a healthy weight in older age isn’t just about numbers—it’s about nourishing the body, preserving mobility, and supporting independence.
Sample Nutrition Tips
Based on guidance from Healthline and WebMD4, here’s what senior women should prioritize:
- Protein-Rich Foods: To combat muscle loss, include lean meats, eggs, legumes, tofu, and dairy.
- Calcium & Vitamin D: Crucial for bone health—try fortified cereals, leafy greens, and low-fat milk.
- Fiber: Supports digestion and heart health—opt for whole grains, fruits, and vegetables.
- Hydration: Seniors often feel less thirsty—encourage water, herbal teas, and low-sodium broths.
- Healthy Fats: Choose avocados, nuts, seeds, and olive oil over saturated fats.
Sample Meal Plan (One Day)
|
Meal |
Foods |
|
Breakfast |
Oatmeal with berries and chia seeds + low-fat milk |
|
Lunch |
Grilled salmon + quinoa + steamed broccoli + lemon vinaigrette |
|
Snack |
Greek yogurt with honey and walnuts |
|
Dinner |
Lentil soup + whole grain toast + mixed greens salad |
|
Hydration |
Water, herbal tea, or diluted fruit juice throughout the day |
Safe & Effective Exercises for Elderly Women
Regular physical activity improves balance, strength, and mood. Here are senior-friendly options4:
- Walking: Low-impact and great for cardiovascular health.
- Chair Yoga: Enhances flexibility and reduces joint stiffness.
- Resistance Bands: Builds muscle without strain—ideal for home workouts.
- Tai Chi: Improves balance and reduces fall risk.
- Swimming or Water Aerobics: Gentle on joints and excellent for endurance.
Aim for 150 minutes of moderate activity per week, plus 2 days of strength training.
Ethnic & Genetic Considerations in BMI Assessment
BMI is a standardized tool, but it doesn't account for the diversity of body composition across ethnic groups or individual genetic predispositions. This can lead to misclassification of health risks, especially in older adults from non-European backgrounds.
Ethnic Variations in BMI Thresholds
- Asian populations tend to have higher body fat percentages at lower BMIs. As a result, the World Health Organization recommends lower BMI cutoffs for overweight and obesity in Asian adults (e.g., overweight starting at BMI 23).
- African American women may have higher lean muscle mass, which can result in a higher BMI without corresponding increases in health risk.
- Hispanic populations show varied patterns of fat distribution, often with increased central adiposity, which may not be fully captured by BMI alone.
These differences suggest that ethnicity-specific BMI thresholds may be more appropriate for assessing health risks. Multi-ethnic studies have shown that tailoring BMI interpretation to ethnic background can improve accuracy in predicting conditions like diabetes and cardiovascular disease.
Genetic Predispositions and Obesity Risk
- Genetic factors account for an estimated 40–70% of variation in BMI across individuals.
- Certain gene variants, such as those in the FTO and TCF7L2 genes, have been linked to increased susceptibility to obesity and type 2 diabetes in specific ethnic groups.
- These predispositions may influence how the body stores fat, responds to diet, and regulates metabolism—making personalized approaches to weight management more effective.
Understanding these nuances helps caregivers and healthcare providers make more informed decisions when evaluating BMI in elderly women from diverse backgrounds.
Practical Tips for Monitoring BMI in Senior Women
Monitoring BMI in older adults is not just about tracking numbers—it’s about observing trends that may signal underlying health changes. Here’s how to approach it thoughtfully:
How Often Should Seniors Check Their BMI?
- Routine Monitoring: For generally healthy seniors, checking BMI every 3 to 6 months is sufficient.
- Medical Conditions Present: If managing chronic conditions like diabetes, heart disease, or osteoporosis, BMI should be tracked monthly or as advised by a healthcare provider.
- After Major Life Events: Weight changes following surgery, illness, or medication adjustments warrant closer monitoring.
What to Do if BMI Is Rising or Falling Unexpectedly
- Unintended Weight Loss: A sudden drop in BMI may indicate malnutrition, muscle loss, or underlying illness. This should be addressed immediately with a healthcare provider.
- Rapid Weight Gain: A rising BMI could signal fluid retention, reduced mobility, or dietary imbalance. Consider reviewing medications and lifestyle habits.
- Stable but Concerning Trends: Even if BMI changes are gradual, consistent movement outside the healthy range should prompt a deeper assessment of diet, activity, and overall health.
Tips for Caregivers Supporting Healthy Weight Management
- Encourage Balanced Meals: Focus on nutrient-dense foods that support muscle and bone health.
- Promote Gentle Activity: Daily walks, stretching, or light resistance exercises can help maintain mobility and prevent weight-related complications.
- Monitor Hydration and Appetite: Dehydration and reduced appetite are common in seniors and can skew BMI readings.
- Use Visual Tracking Tools: Maintain a simple chart or app to log BMI, waist circumference, and body weight over time.
- Watch for Emotional Changes: Depression or anxiety can affect eating habits and weight—emotional wellness matters too.
Decision-Making Guidance: Interpreting BMI in Context
BMI is a starting point—not a diagnosis. Here's how to help readers make sense of their results and decide what actions to take.
When to Consult a Doctor
- BMI < 18.5 or > 30: These ranges may indicate undernutrition or obesity, both of which carry health risks in seniors.
- Sudden Changes: Any rapid shift in BMI, especially when accompanied by fatigue, weakness, or swelling, should be evaluated.
- Chronic Conditions: If the senior has diabetes, heart disease, or osteoporosis, BMI should be part of a broader health review.
When to Adjust Lifestyle
- BMI in the “Overweight” Range (25–29.9): This may be acceptable in older adults if accompanied by good mobility and no chronic disease. However, gentle lifestyle tweaks—like improved diet or increased activity—can help maintain health.
- BMI in the “Normal” Range (18.5–24.9): Focus on preserving muscle mass and bone density through protein intake and strength exercises.
When Not to Worry
- Stable BMI with Good Function: If the senior is active, eating well, and free of major health issues, a slightly elevated BMI may not be cause for concern.
BMI Alone Doesn’t Tell the Whole Story: Always consider waist circumference, body composition, and overall vitality before making decisions.
Products for Older Women to Help Maintain a Healthy BMI from Health Supply 770
Maintaining a healthy weight is crucial for elderly women, and having the right tools can make this task easier and more effective. Health Supply 770 offers a range of products designed to support seniors in their weight management journey. Accurate digital scales help monitor weight changes precisely, while BMI calculators provide essential insights into body composition.
One notable product is the Health-o-Meter 500KL Digital Beam Scale, commonly used in physician offices. This scale boasts a high 500 lb./220 kg capacity with professional-grade accuracy. It features an easy-to-use built-in height rod, a low platform height for stability, and the ability to calculate Body Mass Index (BMI). Additionally, the scale offers USB connectivity to PC or EMR software, making it ideal for both medical and home settings. The extra-large base and quick, accurate weighing process ensure a comfortable and reliable user experience.
To keep track of physical activity, fitness trackers are invaluable. Additionally, nutritional supplements and exercise equipment support overall health and fitness, and blood pressure monitors help manage cardiovascular health, which is closely linked to weight. Explore these products to maintain a balanced and healthy lifestyle.
By integrating these products into your daily routine, you can take proactive steps toward achieving and maintaining a healthy BMI, ensuring a better quality of life. Visit Health Supply 770 shop to find the best products for your health needs.
Conclusion
Maintaining a healthy weight with the progressing age is a challenge for many. Although its significance is undeniable as being overweight brings a number of health problems with it, the effort of keeping the weight within the healthy range is also difficult for the elderly.
A BMI exceeding the normal value is mostly due to the presence of diseases such as stroke, diabetes, blood pressure, among others. Overall, the BMI for over 60-year-old women is a useful parameter for the determination of body fat followed by a subsequent adjustment of diet and lifestyle.